 Local health profiles provide a snapshot overview of health for each local authority in England. The 4 page document gives an overview of local health, health inequalities, child health and adult health all compared to the national average. It will also give an indication of any key local priorities.
How can it be used?
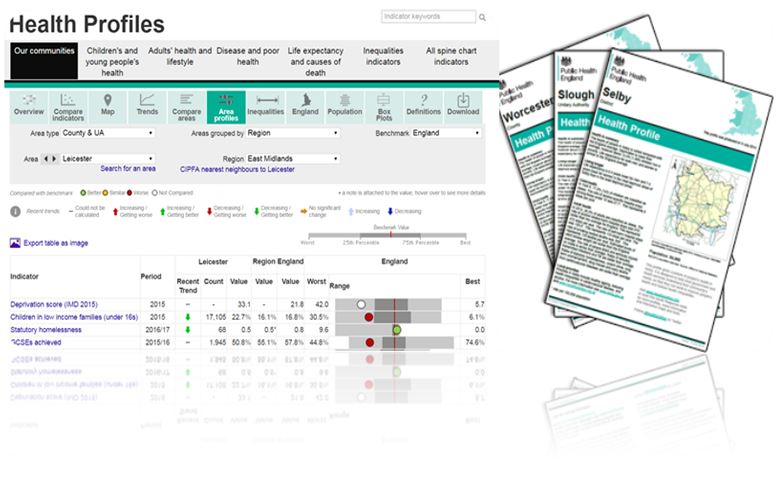
The final page of the profile is particularly useful as it shows how the local area health compares with the rest of England against 30 key indicators. The results for each indicator are shown as a circle, whilst the average rates for England are shown by a black line. A red circle means that the area is significantly worse than the national average.
For example a red circle against sexually transmitted infections (STI) could suggest the need for STI test and treat services, whilst a red circle against smoking status at time of delivery could identify a need for smoking cessation services specifically targeted at pregnant women. It may also encourage you to run a smoking cessation awareness campaign and even link up with local maternity centres or health visitors.
Action:
Click here to read and download your local health profile. Read the summary page at the front and the chart at the back. Look at areas where you are significantly worse than the national average and identify possible services which could support these areas.